Most Commented
Visualizing Data with MongoDB Charts


Description material

Visualizing Data with MongoDB Charts
Language: English | Size:130.63 MB
Genre:eLearning
Files Included :
1 Course Overview.mp4 (3.74 MB)
MP4
1 Version Check.mp4 (543.22 KB)
MP4
2 Agenda.mp4 (726.38 KB)
MP4
3 What Is MongoDB Charts.mp4 (2.94 MB)
MP4
4 Set up Atlas Cluster.mp4 (5.23 MB)
MP4
5 User Access and Permissions.mp4 (2.4 MB)
MP4
6 Loading Sample Dataset.mp4 (2.96 MB)
MP4
7 Working with Dashboards.mp4 (2.86 MB)
MP4
8 Import JSON Data.mp4 (6.34 MB)
MP4
9 Summary.mp4 (426.03 KB)
MP4
1 Agenda.mp4 (842.59 KB)
MP4
2 Structure of Datasets.mp4 (5.48 MB)
MP4
3 Encoding Channels.mp4 (2.64 MB)
MP4
4 Creating Donut Chart.mp4 (3.74 MB)
MP4
5 Visualizing Using Bar Chart.mp4 (8.15 MB)
MP4
6 Building Column Chart.mp4 (8.18 MB)
MP4
7 Building Text Chart.mp4 (7.22 MB)
MP4
8 Summary.mp4 (600.23 KB)
MP4
1 Agenda.mp4 (450.02 KB)
MP4
2 Creating Grid Charts.mp4 (10.03 MB)
MP4
3 Building Line and Area Charts.mp4 (8.9 MB)
MP4
4 Visualize Geo Data Using Geospatial Charts.mp4 (8.54 MB)
MP4
5 Learning More About Dashboards.mp4 (2.72 MB)
MP4
6 Summary.mp4 (528.43 KB)
MP4
1 Agenda.mp4 (473.48 KB)
MP4
2 Customizing Charts.mp4 (8.43 MB)
MP4
3 Embedding Charts - Unauthenticated Sharing.mp4 (6.38 MB)
MP4
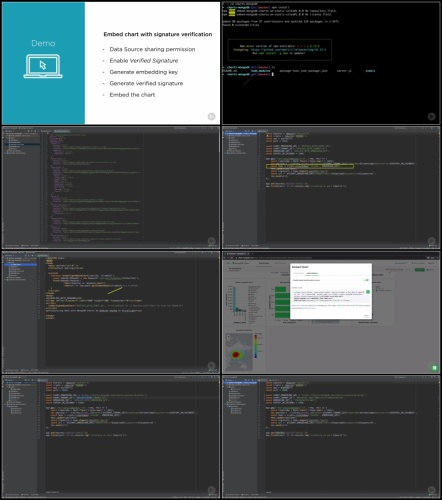
4 Embedding Charts - Verified Signature.mp4 (16.06 MB)
MP4
5 Where to Go Next.mp4 (875.25 KB)
MP4
6 Summary.mp4 (731.96 KB)
MP4


Join to our telegram Group
Information
Users of Guests are not allowed to comment this publication.
Users of Guests are not allowed to comment this publication.
Choose Site Language
Recommended news
Commented


![eM Client Pro 9.2.1735 Multilingual [Updated]](https://pikky.net/medium/wXgc.png)


![Movavi Video Editor 24.0.2.0 Multilingual [ Updated]](https://pikky.net/medium/qhrc.png)

