Keep downtopc Online Please

Categories
PREMIUM ACCOUNTS
Support downtopc by buying or renewing your premium account using below links:


Most Commented

![eM Client Pro 9.2.1735 Multilingual [Updated]](https://pikky.net/medium/wXgc.png)
Partners


Grafana and PromeTheus Monitoring tool for Kubernetes


Description material

Grafana and Prometheus Monitoring tool for Kubernetes
Language: English | Size:759.08 MB
Genre:eLearning
Files Included :
1 - Simple way to install Grafana Prometheus in Kubernetes Cluster.mp4 (133.1 MB)
MP4
2 - Setup basic grafana dashboard.mp4 (43.6 MB)
MP4
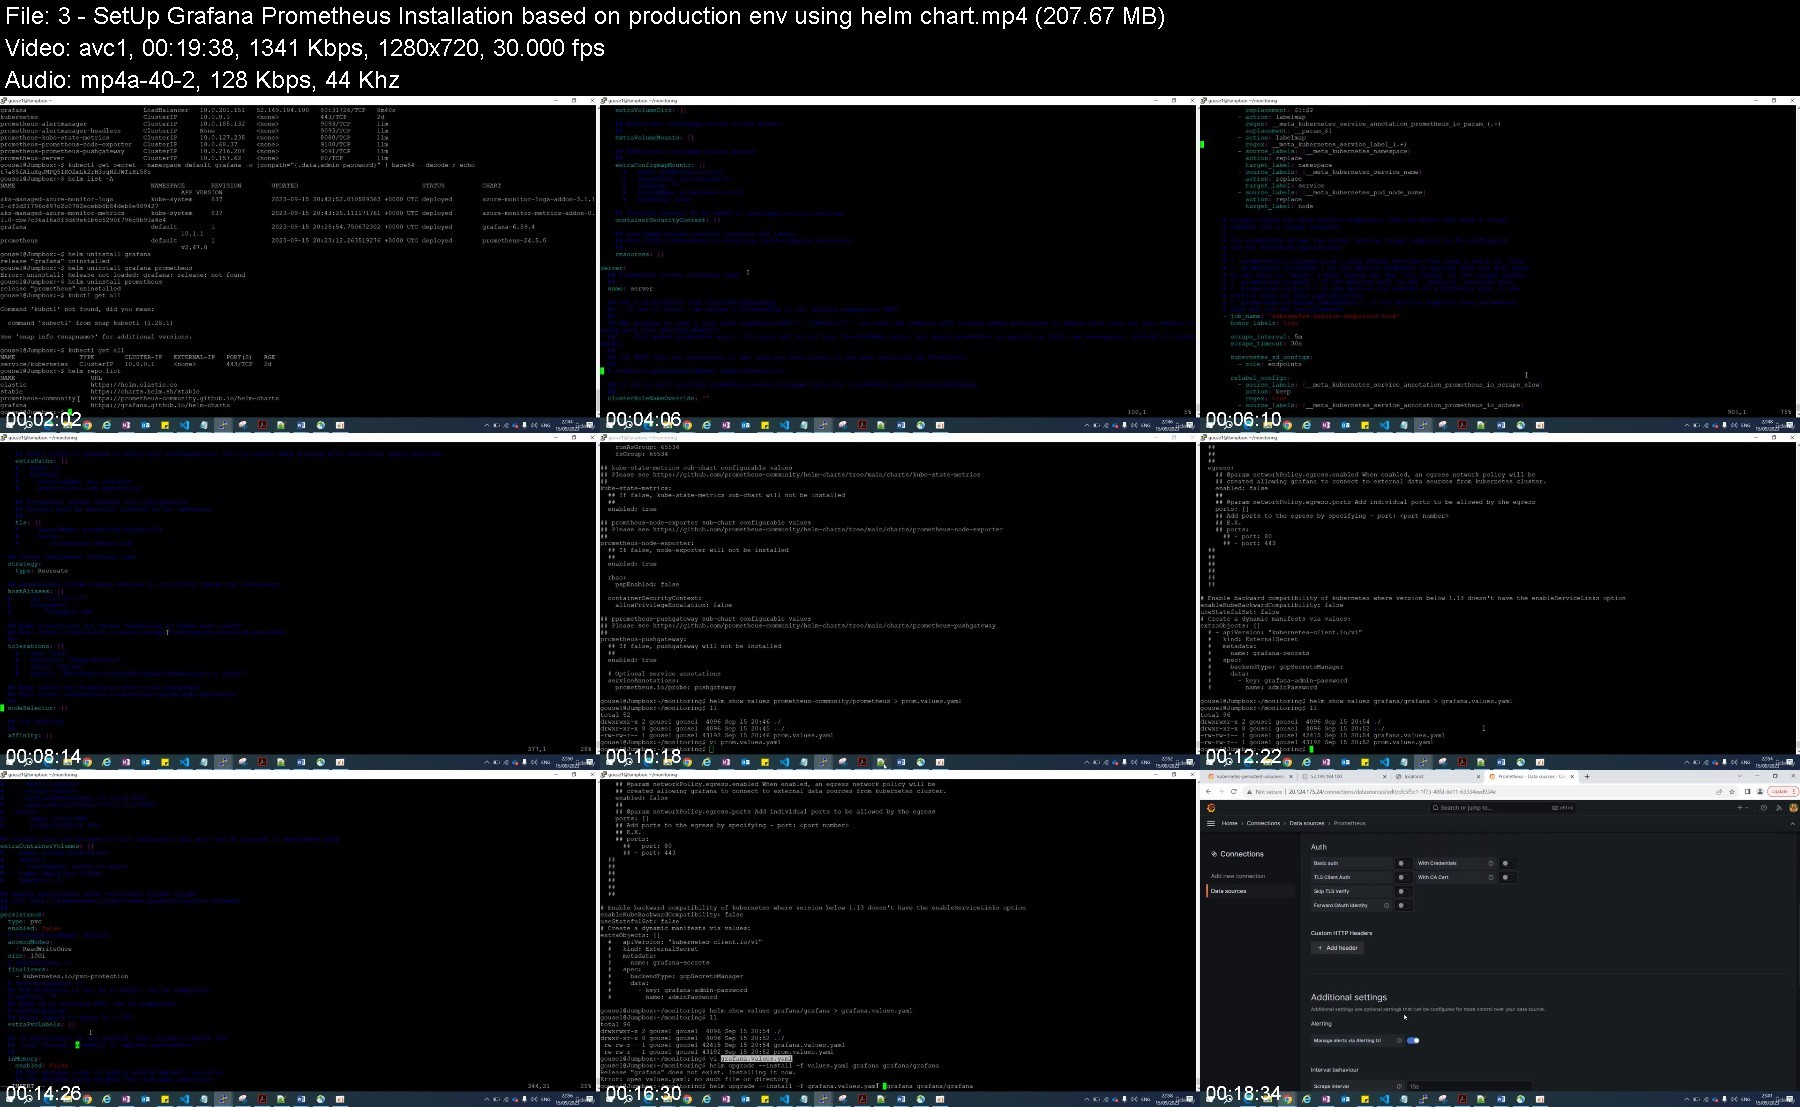
3 - SetUp Grafana Prometheus Installation based on production env using helm chart.mp4 (207.67 MB)
MP4
4 - Set Up Grafana dashboard on Cluster Level Monitoring.mp4 (34.9 MB)
MP4
5 - SetUp Grafana Dashboard on NameSpace Level Monitoring.mp4 (39.81 MB)
MP4
6 - SetUp Grafana Dashboard on Node Level Monitoring.mp4 (84.65 MB)
MP4
7 - SetUp Grafana Dashboard on Persistent Volume PVC Disk Level Monitoring.mp4 (89.95 MB)
MP4
8 - Grafana Dashboard Vanished after pod Restart Troubleshooting.mp4 (125.41 MB)
MP4


Join to our telegram Group
Information
Users of Guests are not allowed to comment this publication.
Users of Guests are not allowed to comment this publication.
Choose Site Language
Keep downtopc Online Please
PREMIUM ACCOUNTS
Support downtopc by buying or renewing your premium account using below links:
Recommended news


Commented
![Movavi Video Editor 24.0.2.0 Multilingual [ Updated]](https://pikky.net/medium/qhrc.png)


All files on the site are presented for informational purposes.
Copyright © 2025 - Downtopc | All rights reserved