Most Commented
Udemy - Grafana 11 from ZERO to advanced - Apasoft Training


Description material

3.86 GB | 00:08:48 | mp4 | 1280X720 | 16:9
Genre:eLearning |Language:English
Files Included :
1 Introduction to the course (17.12 MB)
2 Course Content (12.86 MB)
2 2 20-Course Content (4.44 MB)
1 Introduction to MySQL Connectors (20.14 MB)
10 Prometheus and mysqld exporter Part 2 Configure Prometheus with other job (26.82 MB)
11 Prometheus mysqld exporter Part 3 Work with Grafana (47.8 MB)
12 Import a ready-made MySQL Dashboard (28.34 MB)
15 Create a SQLServer with Amazon AWS if you don't have one (34.35 MB)
16 An example with Microsoft SQL Server (31.03 MB)
17 Create a PIE chart (22.07 MB)
3 Create a connection with the MySQL connector built into Grafana (47.68 MB)
4 Create a Bar Chart with a Query (28.58 MB)
5 STAT type graphics Calculating the total units (25.08 MB)
6 Checking the space occupied by databases with a STAT graph (22.15 MB)
7 Histograms Introduction (15.2 MB)
8 Example of a histogram (17.64 MB)
9 Prometheus and mysqld exporter Part 1 Download and start mysqld (34.48 MB)
1 Introduction to transformations (18.66 MB)
2 create a calculated field (36.92 MB)
3 Options for a transformation (19.35 MB)
4 Filter fields (18.35 MB)
5 Group by and Sort by (16.55 MB)
6 Filter by value and Convert fields (24.23 MB)
7 Grouping By Matrix Transformation with a STATE TIMELINE type graph (54.25 MB)
1 Introduction to alerts (54.5 MB)
10 Create an alert from a panel (18.9 MB)
11 Another example of Contact Point Discord (11.61 MB)
12 Alert type chart (12.65 MB)
2 Review of the alerts screen (17.29 MB)
3 Create an alert Part 1 (33.96 MB)
4 Create an alert Part 2 (26.79 MB)
5 Testing the alert (33.16 MB)
6 Create an email contact point (37.83 MB)
7 Create a Notification Policy (14.73 MB)
8 Test an alert with the notification policy (50.79 MB)
9 Send the alert to a contact point directly (26 MB)
1 InfluxDb introduction (14.33 MB)
2 Download InfluxDB (26.93 MB)
3 Install InfluxDB (35.2 MB)
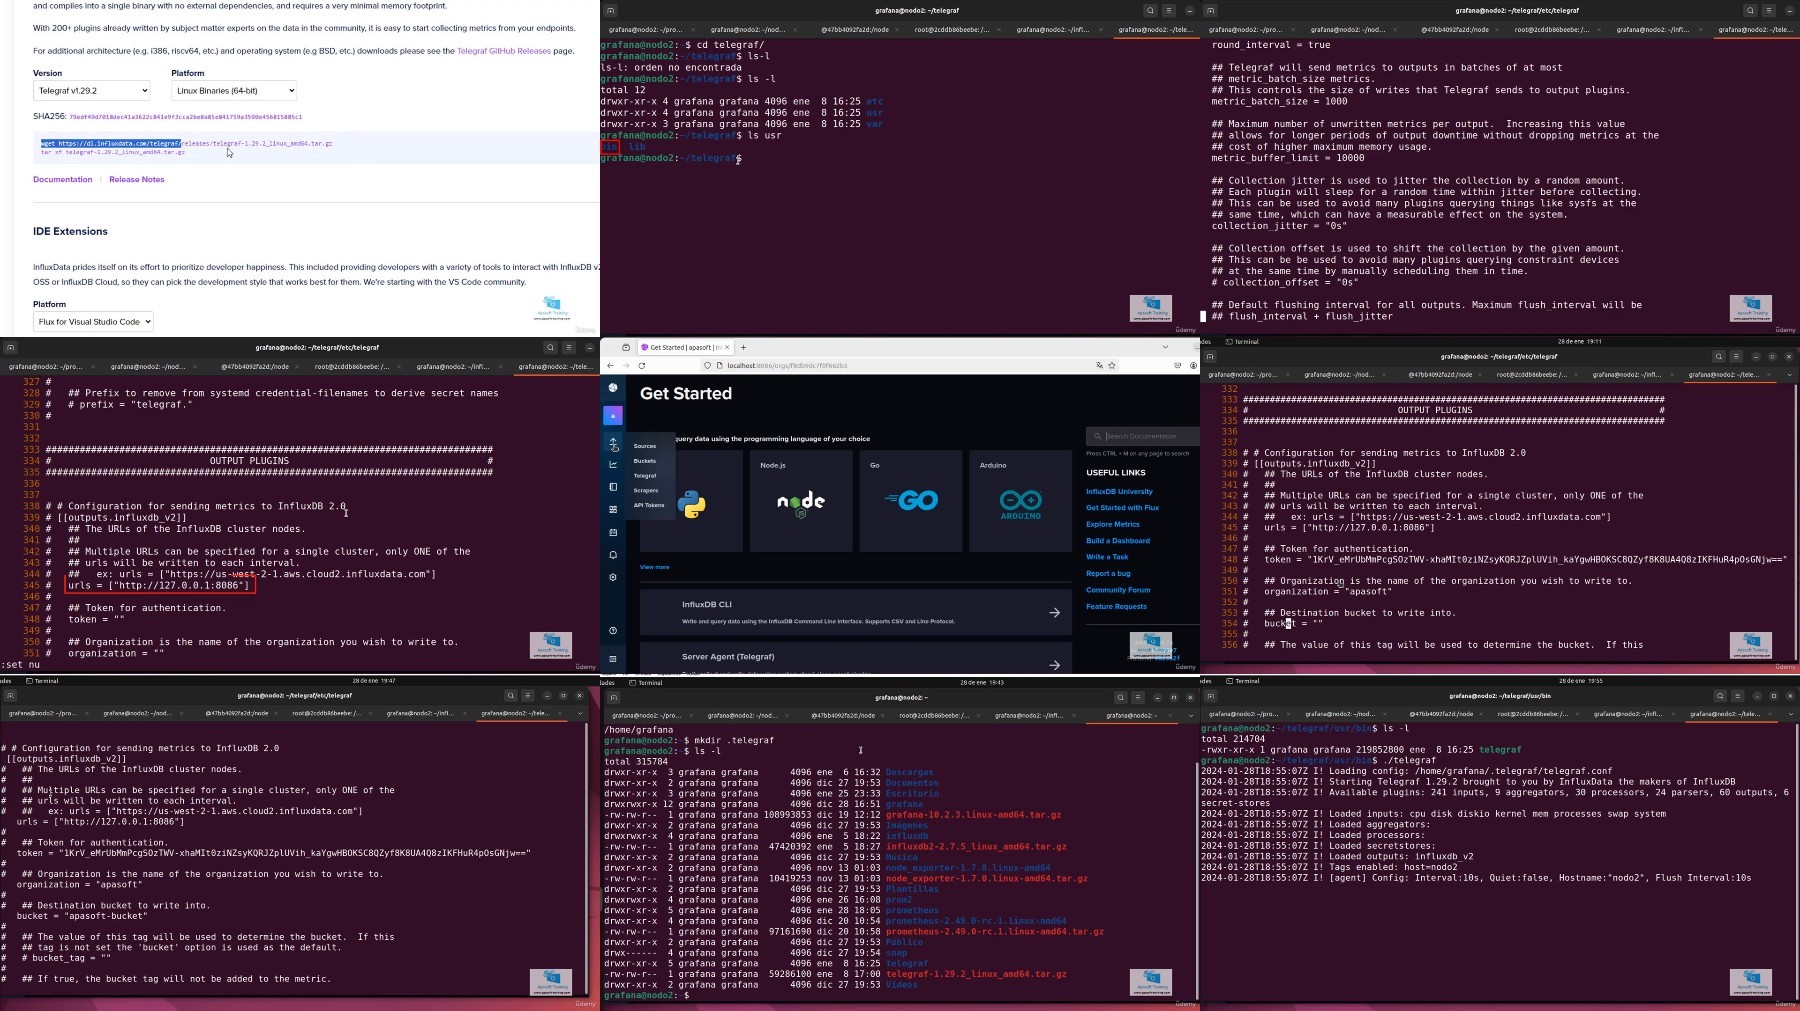
4 Install and configure Telegraf (80.18 MB)
4 1 Cap 118 - Installing and configuring Telegraf (42.66 MB)
5 A comment on InfluxDB versions and their languages (13.67 MB)
6 Create a DataSource with the Flux language (10.18 MB)
7 Import a complete DashBoard with Flux language (21.77 MB)
8 Create a DataSource with FluxQL language (25.86 MB)
9 Create a Dashboard with FluxQL (13.21 MB)
1 TEXT type display Part 1 (30.4 MB)
2 TEXT type display PART 2 HTML and jаvascript (33.94 MB)
3 Heatmaps (57.22 MB)
4 Canvas (42.15 MB)
5 Candlestick (29.28 MB)
6 Maps Part1 (41.52 MB)
7 Maps Part 2 (41.76 MB)
1 Introducción a los plugins (37.51 MB)
2 Polystat Install a panel plugin (57.84 MB)
3 Redis Install an App type plugin (30.59 MB)
4 Install a plugin from GRAFANA CLI (56.03 MB)
1 Enterprise License and Default preferences (14.38 MB)
2 Organizations (14.84 MB)
3 Users (23.75 MB)
4 Teams (13.63 MB)
5 Dashboard permissions (11.62 MB)
1 End of the course (3.84 MB)
1 Introduction to observability (37.18 MB)
2 Introduction to Grafana (22.93 MB)
3 History of Grafana (19.01 MB)
4 Options for using Grafana (21.28 MB)
5 Grafana Play (10.6 MB)
6 Other Grafana products Loki, Tempo, Mimir (29.05 MB)
1 Download and installation Options (7.86 MB)
2 Installation on Windows (24.85 MB)
3 Installation with package manager on Linux Example with Ubuntu (43.94 MB)
4 Standalone installation in Linux (37.31 MB)
5 Install in Docker (33.17 MB)
6 Create an account in Grafana Cloud (30 MB)
7 Grafana directories and files (16.91 MB)
8 Configuration File (31.41 MB)
1 Console Review Part 1 (29.46 MB)
10 Add a panel to the Dashboard Table Chart (27.7 MB)
11 Add a row (11.62 MB)
12 Folders (20.51 MB)
2 Console Review Part 2 (19.16 MB)
3 What is a dashboard in grafana (23.39 MB)
4 Dashboard construction process (39.82 MB)
5 Create a dashboard with Grafana test data (40.13 MB)
6 Create our first Dashboard, Part 1 Load the plugin for CSV files (36.97 MB)
7 Create our first Dashboard, Part 2 Create the DataSource (31.9 MB)
8 Create our first Dashboard, Part 3 Create the Dashboard (33.19 MB)
9 Modify some graph properties (50.17 MB)
1 Let's talk about time series (49.74 MB)
2 Installing the Infinity connector for a JSON file WEB server requests (18.56 MB)
3 Create a Time Series dashboard (26.92 MB)
4 Work with time ranges (20.4 MB)
5 Modify some graph properties (22.71 MB)
1 Introduction to Prometheus (27.66 MB)
10 Add a query (10.79 MB)
11 An example with PromQL (54.35 MB)
12 Use indicator type graphics (Gauge) View used memory (23.73 MB)
13 Practical laboratory Stress the machine's memory (33.67 MB)
14 Add a second server (with Docker) (46.31 MB)
15 Label Filters (15.22 MB)
16 Use Bar Gauge type charts See labels in the legend and other options (36.64 MB)
17 Import a ready-made dashboard (57.98 MB)
18 Practical laboratory Set up a second Prometheus environment with Docker Part 1 (38.92 MB)
19 Practical laboratory Set up a second Prometheus environment with Docker Part 2 (42.76 MB)
2 Prometheus architecture (20.49 MB)
20 Practical laboratory Set up a second Prometheus environment with Docker Part 3 (17.57 MB)
21 Using the Prometheus node-exporter image (25.87 MB)
22 Practice step by step Docker environment with 2 prometheus servers and 4 nodes (45.85 MB)
23 Panels with different time frames (24.01 MB)
3 Control a Linux server with Prometheus Proposed architecture (13.79 MB)
4 Control a Linux server with Prometheus Install Prometheus (36.39 MB)
5 Controlar un servidor Linux con Prometheus Node Exporter (58.83 MB)
6 Integrate node exporter with Prometheus Prometheus website (28.47 MB)
7 Control a Linux server with Prometheus Integration with Grafana (24.56 MB)
7 1 Cap 43 - Control a Linux server with Prometheus Integration with Grafana (13.05 MB)
8 Other panel options (21.64 MB)
9 Autorefresh (13.98 MB)
1 Practical laboratory Monitor a Windows Server Windows Exporter (60.56 MB)
2 Practical lab Windows Exporter as a service (6.37 MB)
3 Import a Dashboard made to monitor Windows (19.69 MB)
1 Introduction to variables in Grafana (41.71 MB)
2 Custom type variables (33.05 MB)
3 Text Box Variables (43.66 MB)
4 Query variables (26.12 MB)
5 DataSource Variables (18.8 MB)
6 Interval variables (23.33 MB)
7 Add hoc variables (18.42 MB)
1 Tags (18.2 MB)
10 Inspecting a Panel (22.97 MB)
11 Explorer (45.77 MB)
2 Dashboard Links (24.82 MB)
3 Panel links (25.75 MB)
4 Add information to our panels (5.98 MB)
5 Versions (18.07 MB)
6 Snapshots (28.05 MB)
7 Library Panels (40.38 MB)
8 Public Dashboards (22.42 MB)
[center]
Screenshot

[/center]
Warning! You are not allowed to view this text.
Warning! You are not allowed to view this text.
Warning! You are not allowed to view this text.
Join to our telegram Group
Information
Users of Guests are not allowed to comment this publication.
Users of Guests are not allowed to comment this publication.
Choose Site Language
Recommended news
Commented


![eM Client Pro 9.2.1735 Multilingual [Updated]](https://pikky.net/medium/wXgc.png)


![Movavi Video Editor 24.0.2.0 Multilingual [ Updated]](https://pikky.net/medium/qhrc.png)

