Most Commented
Mastering Performance Analysis With Perf


Description material

Mastering Performance Analysis With Perf
Published 10/2024
MP4 | Video: h264, 1920x1080 | Audio: AAC, 44.1 KHz
Language: English | Size: 2.07 GB | Duration: 6h 18m
Deep Dive into Linux Performance Profiling and Analysis
What you'll learn
Understand the basics of perf - the official Linux performance tool
Learn microarchitectural performance analysis
Profile system and application performance
Create custom performance analyses
Requirements
Familiar with Linux operating systems
No performance engineering experience needed
Description
Start with the fundamentals of performance analysis using perf stat, where you'll learn how to monitor key performance metrics like CPU utilization, cache performance, and context switches. These are essential to a high-level understanding of your application and system performance.From there, you'll advance to Top-Down Microarchitecture Analysis (TMA), a method that helps you drill down into CPU inefficiencies by categorizing execution into retiring, bad speculation, backend bound, and frontend bound. This approach will allow you to precisely identify CPU performance issues.Next, you'll dive into detailed profiling with tools like perf record, perf report, and perf top to analyze workloads and uncover performance bottlenecks. You'll learn techniques like flame graphs for visualizing code execution, off-CPU analysis to detect wait times and latencies, and real-time monitoring techniques to address critical performance issues as they arise.Finally, you'll learn dynamic instrumentation with perf probe, which allows you to insert probes into running code without needing to restart applications. Combined with perf script, you'll learn how to write custom scripts that track specific events, offering deeper insights into application behavior and enabling more tailored performance analyses.By the end of this course, you'll have the skills to identify performance issues and optimize the performance of your applications and systems with confidence.
Overview
Section 1: Get Started
Lecture 1 What You'll Learn
Lecture 2 Setup and Installation
Section 2: Basic Performance Analysis
Lecture 3 Overview
Lecture 4 What Is Software Performance?
Lecture 5 Introduction to perf stat
Lecture 6 Matrix Multiplication
Lecture 7 Monitored Targets
Lecture 8 Performance Events
Lecture 9 Counting Hardware Events
Lecture 10 CPU Utilization
Lecture 11 CPU Benchmark
Lecture 12 Context Switch and CPU Migration
Lecture 13 Page Faults
Lecture 14 Hardware Events
Lecture 15 Symbolic Event Names
Lecture 16 Measuring Energy Consumption
Lecture 17 Summary
Section 3: Microarchitectural Performance Analysis
Lecture 18 Overview
Lecture 19 Understanding the Top-Down Microarchitecture Analysis Method
Lecture 20 Exploring the TMA Metric Hierarchy
Lecture 21 Implementing TMA Metrics with perf stat
Lecture 22 Vector Instructions (Retiring)
Lecture 23 Branch Misprediction (Bad Speculation)
Lecture 24 Memory Bound Issue (Backend Bound)
Lecture 25 False Sharing (Backend Bound)
Lecture 26 Instruction Cache (Frontend Bound)
Lecture 27 Summary
Section 4: Software Performance Profiling
Lecture 28 Overview
Lecture 29 Software Performance Profiling
Lecture 30 Performance Profiling with perf record and perf report
Lecture 31 Real-time Monitoring with perf top
Lecture 32 Flame Graphs
Lecture 33 Workload Characteristics Analysis on Memcached
Lecture 34 Custom Flame Graphs
Lecture 35 Tracepoints
Lecture 36 Off-CPU Analysis
Lecture 37 Summary
Section 5: Dynamic Instrumentation and Scripting
Lecture 38 Overview
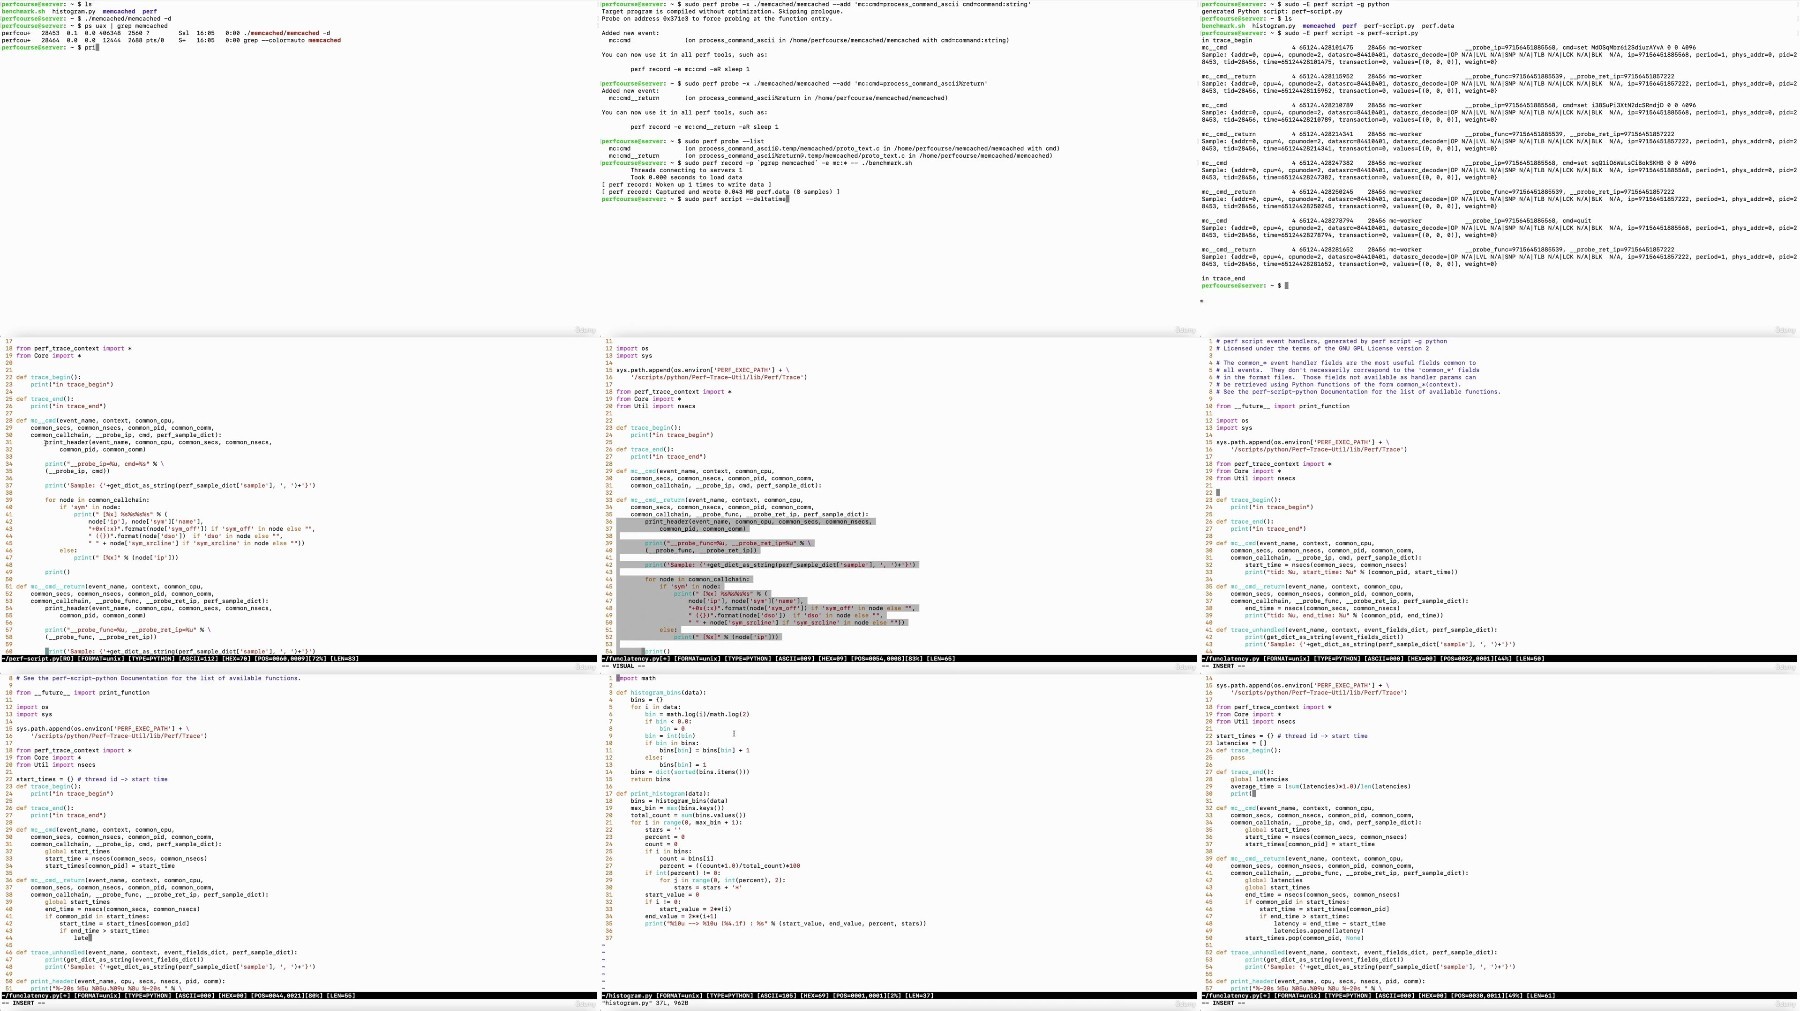
Lecture 39 Dynamic Instrumentation with perf probe
Lecture 40 Catching Crash Points
Lecture 41 Debugging Memcached
Lecture 42 Introduction to perf script
Lecture 43 Function Latency Analysis
Lecture 44 Amdahl's Law
Lecture 45 Summary
Section 6: Bonus
Lecture 46 A Practical Approach
Software engineers working on Linux-based systems need to understand how their applications perform,Performance engineers or anyone specifically focused on the performance of software and systems

Fikper
https://fikper.com/ehrXtqMIhb/Mastering.Performance.Analysis.with.perf.part1.rar.html
https://fikper.com/mzq1HBvwl1/Mastering.Performance.Analysis.with.perf.part2.rar.html
FileAxa
https://fileaxa.com/6rhrs1sdwueq/Mastering.Performance.Analysis.with.perf.part1.rar
https://fileaxa.com/wjb13yshh71c/Mastering.Performance.Analysis.with.perf.part2.rar
RapidGator
https://rapidgator.net/file/7291e4a456a7919b0165cbb3d443638c/Mastering.Performance.Analysis.with.perf.part1.rar
https://rapidgator.net/file/12f2e6589b5ca0829661fd8d528a26e0/Mastering.Performance.Analysis.with.perf.part2.rar
FileStore
TurboBit
https://turbobit.net/n9twu5v5x4ul/Mastering.Performance.Analysis.with.perf.part1.rar.html
https://turbobit.net/fqp47pajxd1l/Mastering.Performance.Analysis.with.perf.part2.rar.html
Join to our telegram Group
Information
Users of Guests are not allowed to comment this publication.
Users of Guests are not allowed to comment this publication.
Choose Site Language
Recommended news
Commented


![eM Client Pro 9.2.1735 Multilingual [Updated]](https://pikky.net/medium/wXgc.png)


![Movavi Video Editor 24.0.2.0 Multilingual [ Updated]](https://pikky.net/medium/qhrc.png)

