Most Commented
Udemy - Observability with Grafana, PromeTheus,Loki, Alloy and Tempo


Description material

1.19 GB | 7min 51s | mp4 | 1280X720 | 16:9
Genre:eLearning |Language:English
Files Included :
001 Evolution of Software Architecture and Observability.mp4 (32.21 MB)
002 What is Monitoring.mp4 (23.25 MB)
003 Methods of Monitoring.mp4 (25.4 MB)
004 What is Observability.mp4 (17.19 MB)
005 Types of Telemetry Data.mp4 (24.46 MB)
001 Methods of Collecting Metrics Push vs Scrape.mp4 (5.03 MB)
001 Installing Prometheus on Windows.mp4 (16.3 MB)
002 Installing Prometheus on Mac OS.mp4 (4.93 MB)
003 Installing Prometheus on Linux (Ubuntu).mp4 (53.31 MB)
004 Collecting Metrics (Unix , Linux and Mac).mp4 (35.95 MB)
005 Node Exporter - Part 1 (Linux, Mac).mp4 (8.48 MB)
006 Node Exporter - Part 2 (Linux, Mac).mp4 (47.43 MB)
007 Node Exporter - Part 3 (Linux, Mac).mp4 (19.89 MB)
008 Running Node Exporter as a Service on Ubuntu.mp4 (16.12 MB)
009 Installing Node Exporter on Mac, with Homebrew.mp4 (14.59 MB)
010 Collecting Metrics in Windows using MMI Exporter.mp4 (44.8 MB)
011 Data Model of Prometheus.mp4 (12.13 MB)
012 Data Types in Prometheus.mp4 (52.24 MB)
013 Binary Arithmatic Operators in Prometheus.mp4 (22.31 MB)
014 Binary Comparison Operators in Prometheus.mp4 (12.12 MB)
015 Set Binary Operators in Prometheus.mp4 (8.85 MB)
016 Matchers and Selectors in Prometheus.mp4 (32.86 MB)
017 Aggregation Operators.mp4 (34.54 MB)
018 Time Offsets.mp4 (23.03 MB)
019 Clamping and Checking Functions.mp4 (34.36 MB)
020 Delta and iDelta.mp4 (8.99 MB)
021 Sorting and TimeStamp.mp4 (20.67 MB)
022 Aggregations Over Time.mp4 (13.6 MB)
001 Cloud or On-Premises.mp4 (12.24 MB)
002 Installing Grafana on Ubuntu.mp4 (21.34 MB)
003 Installing Grafana on Amazon Linux, Red Hat, CentOS, RHEL, and Fedora.mp4 (9.01 MB)
004 Installing Grafana on Windows.mp4 (6.4 MB)
005 Installing Grafana on Mac with Homebrew.mp4 (12.6 MB)
006 Configuring Grafana.mp4 (17.74 MB)
007 Launching Grafana Stack and Prometheus with Docker.mp4 (40.23 MB)
001 Dashboard Design Best Practices.mp4 (17.62 MB)
002 The ShoeHub Global Company!.mp4 (24.4 MB)
003 Connecting Grafana to Prometheus.mp4 (5.16 MB)
004 Creating and Managing Dashboards in Grafana.mp4 (12.71 MB)
005 Creating Your First Panel The Time Series Panel.mp4 (17.38 MB)
006 Multiple and Accumulative Queries.mp4 (35.54 MB)
008 Data Transformations.mp4 (4.61 MB)
009 Visually Comparing Values with Pie Charts.mp4 (6.35 MB)
010 Comparing Metric Data of Two Different Times (Time Shift).mp4 (5.06 MB)
012 Thresholds in Grafana.mp4 (7.74 MB)
013 Variables and Dynamic Dashboards.mp4 (31.02 MB)
015 Solved Creating Dynamic Dashboards.mp4 (23.07 MB)
016 Increasing the visibility of data with logarithmic scaling.mp4 (4.52 MB)
017 Working with the Gauge and Bar Gauge Panels.mp4 (10.04 MB)
001 About Alerts in Grafana.mp4 (4.88 MB)
002 Working with Alert Rules.mp4 (23.87 MB)
003 Notification Policies and Contact Points.mp4 (8.57 MB)
004 Sending Alert Notifications to Slack.mp4 (8 MB)
005 Silencing Alert Notifications.mp4 (1.69 MB)
006 Annotations.mp4 (13.68 MB)
001 Integration of Grafana with MySQL.mp4 (13.34 MB)
002 Integration of Grafana with SQL Server.mp4 (19.82 MB)
003 Integration of Grafana with AWS Cloudwatch.mp4 (35.29 MB)
004 Monitoring Google Cloud Platform with out-of-the-box dashboards.mp4 (33.05 MB)
001 About Grafana Loki.mp4 (9.84 MB)
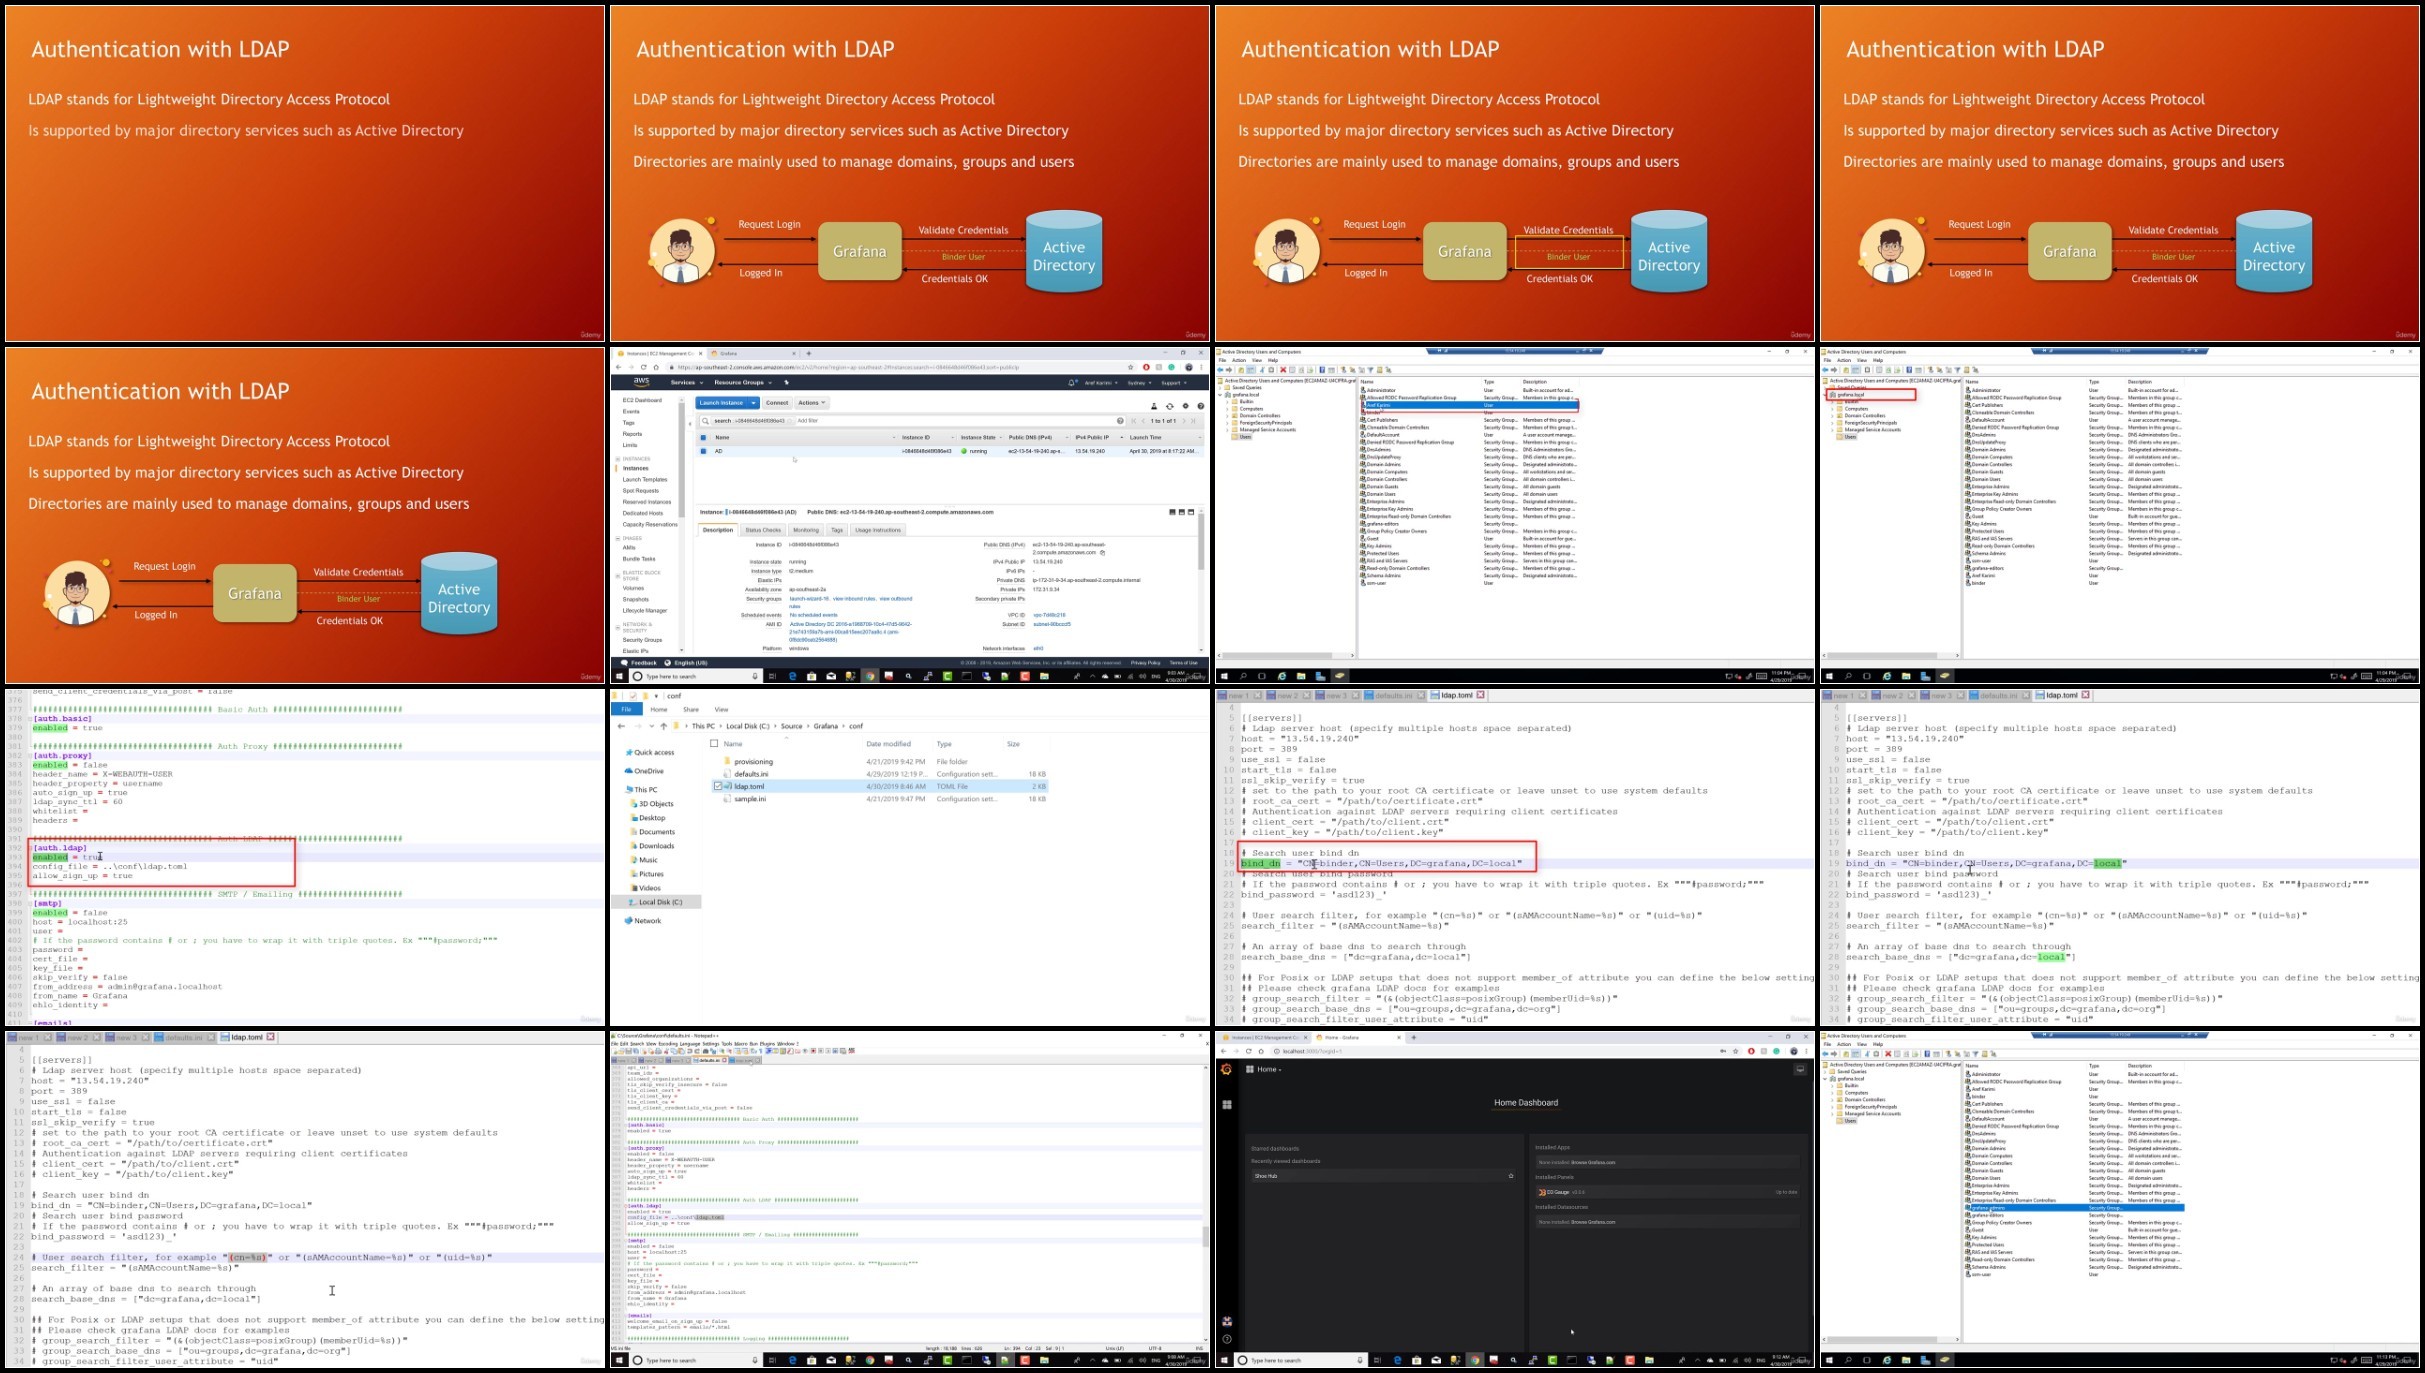
004 Authenticating Users with Active Directory.mp4 (59.6 MB)]
Screenshot


Join to our telegram Group
Information
Users of Guests are not allowed to comment this publication.
Users of Guests are not allowed to comment this publication.
Choose Site Language
Recommended news
Commented


![eM Client Pro 9.2.1735 Multilingual [Updated]](https://pikky.net/medium/wXgc.png)


![Movavi Video Editor 24.0.2.0 Multilingual [ Updated]](https://pikky.net/medium/qhrc.png)

